The Deeper Dive: MA Enrollment Update: Beneficiaries Continue to Choose Medicare Advantage

Molly T. Turco – BMA Policy and Research Director
As beneficiaries look towards Medicare Advantage (MA) open enrollment in the fall (October 15 – December 7), multiple recent reports and data releases show that the popularity of MA continues to grow. Throughout the country, Medicare beneficiaries have access to a variety of MA plans and the quality of these plans is high and getting higher. Below are key trends and insights Better Medicare Alliance (BMA) has observed.
ENROLLMENT IN MEDICARE ADVANTAGE CONTINUES TO GROW
According to the June 2016 CMS enrollment summary report, enrollment in MA is currently 17.3 million individuals – an 80% increase since 9.7 million individuals were enrolled in MA in 2008. Enrollment now constitutes roughly 1/3 of the more than 57 million eligible Medicare beneficiaries. When you include Programs of All-Inclusive Care for the Elderly (PACE) plans, which provide comprehensive medical and social capitated managed care benefits for the frail elderly, as well as Cost plans, a type of Medicare health plan available in certain areas of the country, total enrollment in private plans in Medicare has grown to over 18 million individuals. CBO estimated in its March 2016 report that MA enrollment is estimated to grown to 30 million individuals over the next 10 years.
GEOGRAPHIC VARIATION IN MA PENETRATION
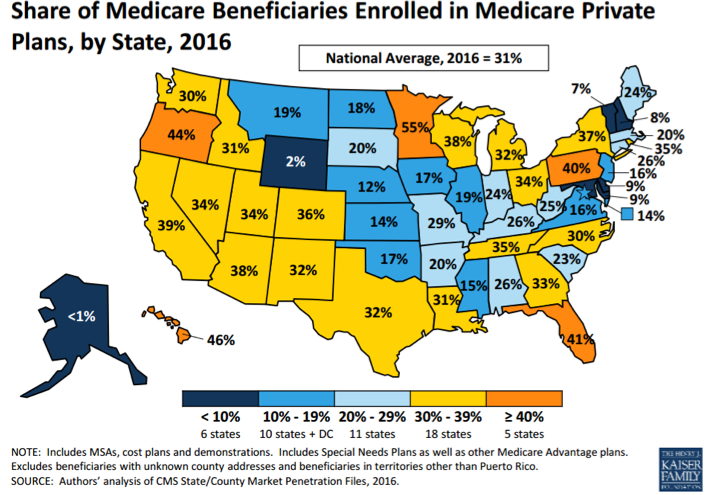
Recent reports prove that MA popularity continues to grow and the percent of Medicare beneficiaries choosing MA (MA penetration) continues to go up. However, nationally-averaged MA penetration rates blunt the reality of geographic variation throughout the country. A recent Kaiser Family Foundation 2016 Fact Sheet (see map below) illustrated that despite penetration growth nationally, there is still geographic variation. This variation is due to many factors, including long-term insurance market factors in state as well as specific characteristics of each state – for example, low penetration rates due to a state being rural and sparsely populated (e.g. Vermont, Wyoming), or high penetration rates due to a concentration of retirees (e.g. Florida, Arizona) or a large number of hospital-owned plans (e.g. Minnesota, Oregon).
MA IN YOUR LOCAL CONGRESSIONAL DISTRICT
Updated information regarding MA penetration by Congressional district is gathered by Centers for Medicare and Medicaid Services (CMS) but can sometimes be hard to find. This is why we at the Better Medicare Alliance believe our new interactive Medicare Advantage enrollment map can be useful tool – check it out here.
ENROLLMENT IN SPECIALIZED PLANS IS ALSO STRONG
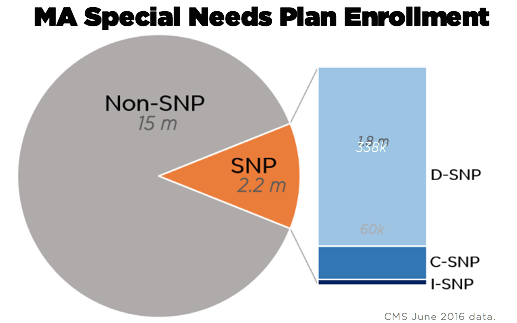
Special Needs Plans (SNPs) were first offered in 2006 and were created to give MA the flexibility to create plans that tailor care for Medicare beneficiaries with specific health care needs. Out of the 31% of Medicare beneficiaries in MA, SNPs make up 13% of MA enrollment. These coordinated care plans are specifically designed to deliver specialized care to individuals in the following three categories:
Dual Eligible (D-SNP): 1.8 million
Individuals dually eligible for Medicare and Medicaid
- Chronic Condition (C-SNP): 338,000
Individuals dually eligible for Medicare and Medicaid
- Institutional (I-SNP): 60,000
Individuals who are institutionalized
EMPLOYERS ARE PROVIDING MA FOR THEIR RETIREES
It is also important to note the growth in employer-sponsored MA plans. Enrollment in MA employer plans (Employer-Group Waiver Plans or “EGWPs”) is currently 3.2 million, 18% of total MA enrollment. EGWPs are especially concentrated in certain regions, especially the Midwest and Texas.
MOST BENEFICIARIES CHOSE COMPREHENSIVE HMO & PPO PLANS
Beneficiaries in MA often choose a comprehensive coverage option – the vast majority of individuals in MA, over 90%, chose to enroll in an MA-PD plan, which also includes their Part D prescription drug benefit. In addition, the Kaiser Family Foundation’s recent Medicare Advantage 2016 Data Spotlight reported that 2/3 of MA beneficiaries chose a Health Maintenance Organization (HMO) plan, which allows beneficiaries to choose from a certain network of providers. The remaining 1/3 of enrollees are primarily enrolled in Preferred Provider Organizations (PPOs), which allow beneficiaries to choose from a wider service area of providers. The breakdown in PPOs is 23% Local PPOs, which include the counties the PPO chooses to include in its service area, and 7% Regional PPOs, which serve one of 26 regions decided by Medicare (may be a single state or multi-state) and are often in rural areas.
ROBUST ACCESS TO MA PLANS
Recent reports show encouraging news that beneficiary access to MA remains strong. In 2016, over 2,000 MA plans were offered for individual enrollment, a slight increase from 2015. In fact, in the Medicare Payment Advisory Commission (MedPAC) March 2016 report to Congress, an annual update to Congress on the MA program, MedPAC reported that 99% of all Medicare beneficiaries have access to an MA plan, and 96% of Medicare beneficiaries have an HMO or Local PPO operating in their county of residence, up from 95% in 2015. In addition, beneficiaries have multiple plans to choose from in their area. A recent Avalere MA 2016 National Snapshot analysis showed that 91% of MA beneficiaries have a choice of at least five MA plan options, 71% have at least 10 MA plans options, and 53% have at least 15 options.
GROWTH OF PROVIDER-LED MA PLANS IMPROVES CHOICE
The increase in beneficiary choice in MA is supported by the growth of provider-sponsored MA plans. The Avalere snapshot stated there are currently over 178 MA parent managed care organizations offering these plans, 70 of which are provider-sponsored organizations. Another Avalere analysis looking specifically at provider-sponsored MA plans reported that there have been 19 new MA organizations in 2016 – 11 of which are sponsored by providers.
QUALITY OF MA PLANS IS HIGH
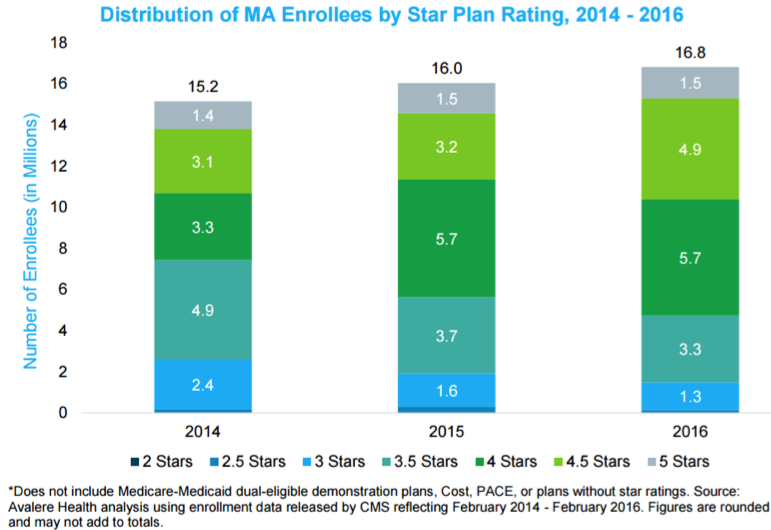
The quality of MA plans continues to improve, and almost 3 out of every 4 beneficiaries are now in top-rated plans – and we anticipate this will be even higher in October when we learn about 2017 Star Ratings. MA plans are awarded Star Ratings between one and five based on performance on certain quality measures in the MA Star Rating system. Currently, over 71% of MA enrollees are in four or five-star plans, almost quadruple the percent in 2009. As illustrated by Avalere below, in 2016, over 12 million beneficiaries were enrolled in high quality 4+ star plans.
LOOKING TOWARDS 2017 MA OPEN ENROLLMENT
It is expected that even more beneficiaries will take advantage of the high quality, specialized, coordinated care MA offers them. From October 15 to December 7, 2016, MA will have its annual open enrollment period when beneficiaries have the opportunity to make coverage changes. However, there are other specific time periods during the year when certain beneficiaries can enroll in MA or make changes to their current coverage depending on whether they are already in the program or enrolling for the first time.
There are multiple resources that beneficiaries and their loved ones can use to help clarify these guidelines, such as the Medicare.gov website and the Centers for Medicare & Medicaid Services (CMS) Understanding Medicare Part C & D Enrollment Periods “Tip Sheet”.